
Building energy grids is slower and more expensive than ever before in British history
A tale of five grid builds, 1926 to 2035

TL:DR
Britain today is much worse at building energy grids than it was in the 1930s, 1950s and 1970s.
Privatisation was supposed to make grid operators more productive. But the nationalised grid builders of the past were much faster and cheaper.
Today’s electricity grid companies can only build at half the speed and cost 70% more per gigawatt of capacity being added. Measured on cost per kilometre, today’s electricity and gas grid companies are 20-25 times more expensive than in the post war years.
This is a productivity puzzle if you are a techno-optimist. Technology and ‘learning curves’ are supposed to drive down the cost of the components which make up energy grids. Networks are supposed to have ‘increasing returns to scale’; as they get denser the cost of adding new spurs off the network should fall.
There are four plausible explanations.
It isn’t a problem. The grid’s we are building today are better and so should cost more; more reliable, safer, made-up of bigger and better kit, accommodating more complex types of generation and demand.
Construction has terrible productivity record, and this cancels out any increasing returns to scale.
Decimation of domestic supply chains. The grids of the 1930s, 1950s and 1970s were built at a time when Britain had a manufacturing base. Almost all the equipment was British made, in huge factories churning out highly standardised kit. Today we buy almost everything from abroad meaning we are a price taker and have less control over the design of the equipment.
The regulatory model has encouraged an inflation of costs.
The puzzle
Why can’t western societies build things anymore? This seems to have become the question of our times. Across Britain, the USA, Canada, Australia and Europe both left and right of the political spectrum are consumed by the puzzle. In the UK a well organised group of bloggers have spent the last year churning out humorous examples of failed infrastructure projects. Ezra Klein and Derek Thompson’s Abundance is littered with stories from the USA of failed railway, road and housebuilding programmes. In a review of Abundance Mile Konczal begins by outlining the frightening scale of the problem:
The Empire State Building, then the world’s tallest building at 102 stories, was completed in 1931. Building that majestic structure, later called one of the Seven Wonders of the Modern World by the American Society of Civil Engineers, took just one year and 45 days. Contrast that with just about anything we try to build now. And it’s not just speed. In the 1970s, 1.7 million new homes were constructed each year. Since 2021, with a population that’s more than 50 percent larger and an ongoing housing crisis, we’ve built only 1.4 million new homes a year.
A related puzzle is that political elites seem unaware of how bad things are. In a recent blog Adam Tooze asked whether German politicians really understood ‘how run down and incapable they have allowed their state to become’? Tooze points to the fact that Germany has essentially lost the ability to send troops to its borders by train – one of the crucial ingredients in the birth of the German nation.
For Britain, the stakes seem particularly high. Groups like Looking for Growth and Britain Remade argue that Britain must get building again or the economy will continue to implode. The Labour Government has wholeheartedly adopted the same philosophy. Energy is a particular focus area. The ‘Clean Power by 2030’ Mission is based on the logic that we must build gargantuan amounts of infrastructure, especially electricity grids, to have an affordable, resilient and decarbonised energy system. Folks in the energy industry largely agree. Go to any energy industry conference and you are guaranteed to hear the words ‘there is no transition without transmission’ (i.e. electricity transmission networks). So, it would seem, the future of civilisation depends on being good at building grids.
The curious case of energy grids in Britain, 1926 to 2035
Have western societies got worse – slower and more expensive – at building stuff? This is a hard question to answer. The degrees of freedom are larger than the number of datapoints. Some kinds of infrastructure – energy networks, railways, motorways – are built infrequently. Comparing between countries is tricky because geographical factors will have a big impact on cost and speed. Comparing over time is also tricky as there are changes to the stuff being constructed. E.g. electric railways are different to steam ones. Even Bent Flyberg’s brilliant How Big Things Get Done doesn’t examine whether the unit cost of mega projects has deteriorated over history.
This blog will examine a single type of infrastructure, energy grids, in Britain over the last 100 years. Given so much seems to rest on building energy grids it is interesting to compare the grid builders of today with their predecessors. There have been three major grid programmes in British history. In electricity, the first National Grid was built between 1926-1935 and the Supergrid was built in the 1950s. In gas the National Transmission System was built in the 1960s and 1970s. Today there are two energy grid mega-projects in the pipeline. Firstly, the electricity ‘Great Grid Upgrade’, which is already underway and will run into the 2030s. Secondly, the much less mature ‘hydrogen backbone’ that the National Infrastructure Commission said might be needed by 2035.
These five grid projects have a nice mix. Two in gas and three in electricity. If the results are the same for both fuels then we can be confident that changes aren’t just down to technological developments in one of the fuels. One of the grid programmes was before the 1947 Town and Country Planning Act, which some people think is the reason Britain can’t build infrastructure in the 2020s, and four are after it. Three of the programmes were under a nationalised and vertically integrated industrial structure, two are in the privatised and unbundled era.
Is it fair to compare these projects? Of course, each one was unique. The first National Grid used a 132 KV voltage level, the Supergrid a 275 KV level, and today’s grid uses up to 400 KV. Adjustments must be made to reflect such factors. Comparison must be fair, because the energy industry regularly does so. The National Energy System Operator compares the Supergrid to the grid of today in the first paragraph of its grand plan for the network to 2050. The slick landing page for National Grid Electricity Transmission’s 5-year business plan has lovely visuals all about the first National Grid and the Supergrid. The implicit claim is that the latest Great Grid Upgrade is part of this lineage. My meagre contribution is to quantify the comparison.
Table 1 compares the three waves of electricity grid construction over the last century on cost, length and capacity unlocked. The three important metrics are: Cost per kilometre of grid, kilometres of grid constructed per year, and cost per gigawatts of capacity added. Cost per kilometre is rough proxy for the cost per unit of output. All costs are included, so the metric factors in the construction of overhead lines, underground cabling, substation builds and everything else. This makes the metric an imperfect measure of productivity, because it will be higher for ‘fatter’ networks with more substation nodes in between all the lines. Kilometres per year is a measure of speed. When a grid programme starts and ends is subjective; should it start when the someone first comes up with the idea, or when a government department signs off on it, or when construction begins? Grids are continuously being added to so in a sense there is no end date. I have taken the start point to be sign off by a significant governmental authority, including agreement to the initial design and budget. The end point has been defined as completion of the majority of the construction works (~90%) and energisation. The kilometres per year measure is also only a rough proxy and suffers the same issues as cost per mile, as it will be lower for grids with lots of substations in between the lines. Cost per gigawatts of capacity added takes the total cost and the gigawatts (GW) of generation capacity added between the grid starting and finishing. This is a rough proxy for the cost of the energy system outcome.
Table 1: The three great electricity transmission grid programmes over last 100 years.

Figure 1 suggests that grid building today is much more expensive per kilometre than it was 70 and 100 years ago. The cost per kilometre was just £277,196 in 1926-1933 and £818,628 in the 1950s. If we assume that these figures need to be adjusted upwards in proportion to the increase in voltage (from 132KV and 275KV to 400KV), the cost per mile would only increase to £0.8m and £1.2m. This is still significantly below the cost of over £20 million per kilometre today. The number of substations associated with each grid build doesn’t seem to explain the cost differences. Today’s Great Grid Upgrade could require 67% more substations than the Supergrid in the 1950s (~52 vs 30), the first National Grid in the 1930s involved building a staggering 237 substations but was still a lot cheaper per kilometre. Both the first National Grid and the Supergrid were on time and on budget.
Figure 1: Cost and speed of the electricity grids over last 100 years
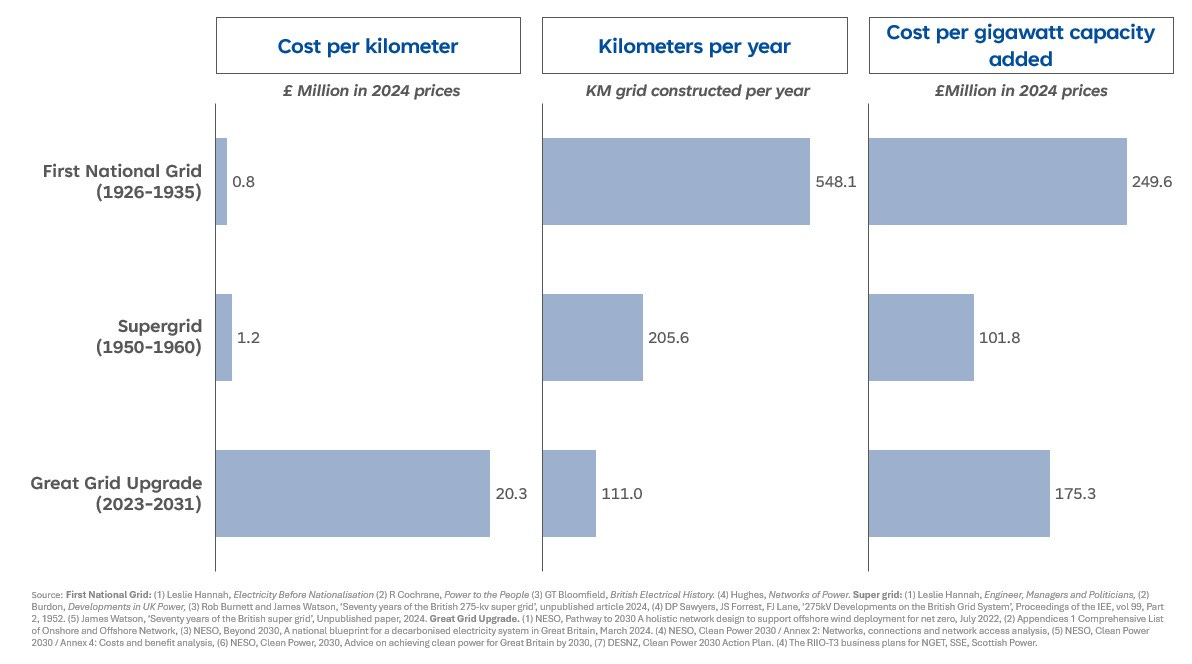
On speed the comparison is just as shocking. Today’s Great Grid Upgrade is projected to go at around half the pace of the Supergrid in the 1950s and just 20% of the pace of the original National Grid. The first National Grid was built ludicrously fast, at a rate of 548 kilometres a year. The rate dropped significantly by the 1950s after the Town and Country Planning Act. The Supergrid engineers complained that this Act, plus the Amenity Clauses in the Electricity Act of 1957, made it much more difficult to work at pace. As one grid planner put it ‘unless we could get their [local authority and community] acceptance when we applied to the Secretary of State for permission to build the line, we would be in for a public inquiry’. Another grid planner complained about a route near Hadrian’s wall, saying ‘it’s a good job Hadrian wasn’t around now…. He’d never get planning permission for all that’. [1] The Supergrid builders dealt with the planning constraints fine. They didn’t whinge and moan. They just convinced the citizens of Britain of the value of the grid.
On cost per gigawatts of capacity being added, the Great Grid Upgrade of today is more cost effective than the first National Grid. Although this just reflects that the objective of the first grid was to connect all the existing generation capacity and actually rationalise it – i.e. shut down lots of power stations to concentrate generation in only the largest stations. When compared to the Supergrid, which was intended to increase the generation capacity of the system to meet rising demand, today’s grid programme is 72% more expensive.[2]
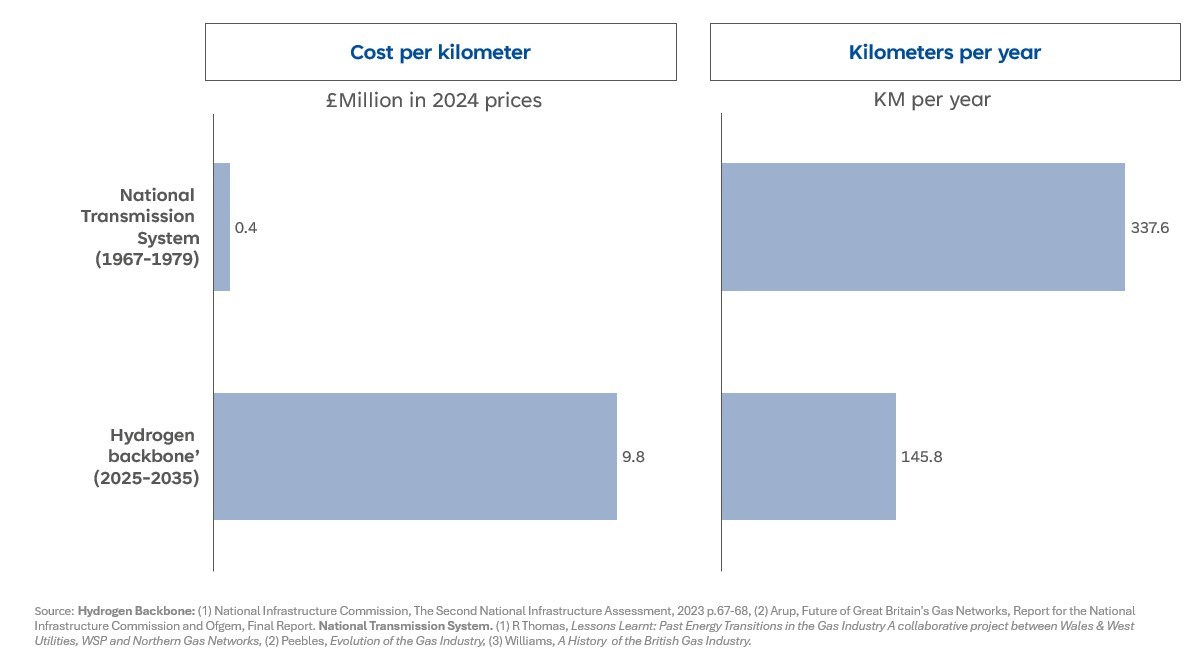
These comparisons should be treated with caution. The information on the latest Great Grid Upgrade is the most uncertain.[3] One sense check is to see if the pattern of rising cost and falling speed also applies in gas. Table 2 compares the proposed ‘hydrogen backbone’ with the original National Transmission System, built between 1967 and 1979 after the discovery of gas in the North Sea. The results are strikingly similar to those in electricity. Cost and speed have deteriorated. If the hydrogen backbone ever comes into existence it is projected to cost 25x more than the original gas grid in terms of cost per kilometre of pipeline. The gas grid builders of the 1970s could also lay pipeline at double the pace. As in electricity, they were on time and on budget. Methane and hydrogen are such different molecules that I couldn’t think of an outcome metric like cost per gigawatt of capacity added. Hydrogen is a much lighter molecule and will require more compression units to push and pull the gas around than is needed in a methane network. This could explain the massive differences in cost and pace.
Table 2: The ‘hydrogen backbone’ compared to the National Transmission System for gas.
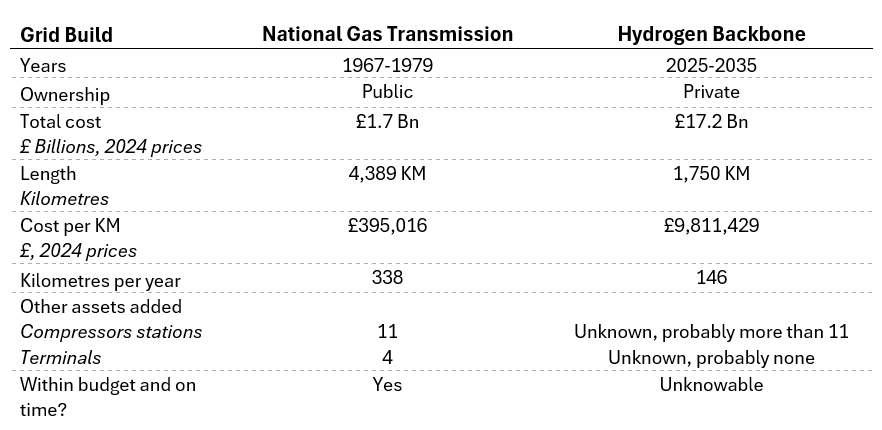
Figure 2: Cost and speed of the first gas transmission system vs the hydrogen backbone proposal today
What’s going on?
I don’t know. I don’t know the breakdown of costs for the Great Grid Upgrade or the ‘hydrogen backbone’ today because the various companies don’t release this data. In the absence of this data, it is impossible to say which activities, goods or services have increased in cost between the 1930s and today. Four explanations seem plausible to me.
Explanation 1: Energy grids today are better
The electricity grid of today is probably more reliable and safer than the grid of the past, although I haven’t identified any quantitative evidence to support this hypothesis. I doubt that a hydrogen grid will be safer than a methane grid. Today’s electricity grid is also being organised around more complex generation. In the 1930s and 1950s coal dominated the generation mix, with some hydro and nuclear. Today’s grid is being built around intermittent renewables, nuclear, hydro, gas, and bi-directional battery storage. All this probably means bigger and better grid equipment, with more components, more redundancy, and more advanced technology. This probably translates into using more aluminium, copper, steel, and expensive metals.
Roughly 60% of the cost of a major electricity grid project is due to kit and construction, or ‘direct costs’ (see Yorkshire Green – Project Assessment). To explain such large increases in unit cost since the 1930s and 1950s, it is probably the case that direct costs have increased significantly.
The issue I have with this explanation is that there should be a countervailing force; productivity improvements in manufacturing grid equipment. One of the first articulations of the ‘experience curve’ was BCG’s founder Bruce Henderson who showed that the cost of steam turbine generators fell as volume increased between 1946 and 1963 (see figure 3). The electricity grid is made up of components like transformers, circuit breakers, reactors, and cables that are produced in massive factories in Germany, the USA and South Korea. Why aren’t the same learning curve effects visible as in steam turbines or other generation technologies today (solar, batteries, wind etc)? It is possible that it is just because the grid is a more mature technology, so there aren’t as many productivity gains to be had.
Figure 3: The original experience curve for steam turbine generators.

Source: Henderson, ‘The Experience curve reviewed’.
Explanation 2: Low productivity construction beats increasing returns to scale
Energy networks are supposed to exhibit what economists call ‘increasing returns to scale’. In other words, as they get bigger and denser the cost of adding new spurs off the network should fall. This is simply because you don’t need to build as much stuff to hook up new locations. Unfortunately, there is a force that counteracts ‘increasing returns to scale’, the terrible productivity of construction. Adding a new spur off a network involves hiring construction companies to assemble all the kit, dig up holes, lay concrete, erect towers and buildings etc. Construction has a terrible productivity record in basically all western economies over the last 30 years (see below). Why? Because it hasn’t been mechanised. Most of the costs are associated with labour. Since wages must increase in line with inflation, construction firms must raise the prices they charge the grid companies. This is known as ‘Baumol’s cost disease’. In summary, increasing returns to scale means building less grid for each wave of grid building (evident in the fact the kilometres added has fallen), but the cost per kilometre has gone up because it is driven by construction firms with terrible productivity.
Figure 4: Productivity of construction in UK

Figure 5: Productivity of construction in the USA

Source; Metrics and Tools for Measuring Construction Productivity: Technical and Empirical Considerations Allison L. Huang, Robert E. Chapman, and David T. Butry, 2009.
Explanation 3: Supply chain erosion
In the grid programmes of the 1930s, 1950s and 1970s most of the equipment came from factories in Britain. The Central Electricity Generating Board and the Gas Council focussed on collaborating with suppliers and helping them to expand manufacturing capacity. They also relentlessly focussed on standardising equipment. Import controls were only selectively relaxed to address bottlenecks.
Over the last 30 years the energy network companies haven’t built very much. It has been an era of asset sweating. This, combined with decades of deindustrialisation, has decimated domestic supply chains. It turns out it is now quite hard to build grids cheaply and at pace if you are dependent on imports. It is also much harder to standardise given factories overseas are catering to a global market, which means that any adjustments for ‘British standards’ adds cost.
Explanation 4: Extraction
Since the 1990s the electricity and gas networks have been in private ownership. Energy networks are natural monopolies, meaning competition isn’t feasible (except for edge cases). Independent regulation was supposed to simulate the effects of competition. Every five years grid companies would estimate how much it would cost them to run the network, and if they could beat that cost, they could keep some of the difference in profit. This was supposed to drive ‘efficiency’, but it only created fictional savings in the sense that the grid’s were ‘saving’ money versus an imaginary counterfactual.
The regulatory model just encouraged network companies to overestimate how much it cost and then underspend. This pattern has persisted since the early 1990s. Suppliers of construction services and equipment probably know this. It is possible that this has led to a pattern of the companies and suppliers constantly ‘padding’ costs, leading to above inflation cost increases little by little over the last 30 years. This wasn’t a problem when the grids weren’t building much, but now they have a gargantuan bow wave of work it is.
Conclusion
In the energy and climate change debate there are lots of self-described ‘techno-optimists’ who rightly point to the falling costs of technologies like renewables and electric vehicles. At conferences it is common to see graphs showing the ever-accelerating pace of deployment of these technologies. Falling cost, increasing velocity. At the same conferences is also common to hear that the electricity grid is now ‘the bottleneck’, and that ‘there is no transition without transmission’. However, today’s Great Grid Upgrade, in Britain at least, is totally unlike what is going on in solar, batteries or wind farms because the unit costs seem to have gone up over the last 100 years. The privatised grid companies of today are more expensive and slower than their predecessors.
[1] Cochrane, Power to the People, pp.43-44
[2] I also calculated the cost per GHW of consumption added before the start and the end of each grid build, and the results are similar. If anything, worse for the Grate Grid Upgrade.
[3] The cost information is based on a projection whereas we know what the last two grid programmes cost. Whereas the last two grids were entirely onshore, the current Great Grid Upgrade involves building lots of offshore High Voltage Direct Current network. For comparability all offshore network costs have been excluded. The low end cost estimate I found comes from a report by the National Energy System Operator on the government’s ‘Clean Power by 2030’ plan, which estimated £1.4Bn of onshore transmission capex over 6 years. However, this is an annuitized value, making it an underestimate and not comparable with figures for the 1930s and 1950s. The top end estimate I found was in the ‘Clean Power 2030 Action Plan’ by the Department for Energy Security and Net Zero. This report estimated an additional £4.7Bn of onshore transmission network capex over the six years between 2025 and 2030. This equates to £28.2Bn. The same report references 1000 KM of new onshore network. The ‘Clean Power Action Plan’ built off various reports by the National Energy System Operator (NESO) that use a lower number of £21.7Bn to refer to the same list of onshore transmission projects. This falls to £20.3Bn when adjusted for inflation and a haircut to the number of projects. These projects are mostly between 2023 and 2032 (8 years). There is no public source giving an official estimate. I have therefore chosen to go with the middle scenario of £20.3Bn, 1000 KM over 8 years.
Explanation 3 and 4 can largely be combined and better understood by the cost to the consumer. The primary reason for the weakening of supply chains is the high cost of infrastructure. The current regulatory system sets use-of-system charges based on the regulated asset value (RAV), meaning that a more expensive asset base results in higher consumer bills. This is further exacerbated by the fact that the RAV is linked to inflation. Network companies are required by their license conditions to run an economically efficient network, which means reinforcement is generally only carried out when necessary (e.g., on customer request or when an asset no longer meets the Electricity Safety, Quality, and Continuity Regulations 2002). As a result, infrastructure is only procured when necessary and at the lowest possible cost in order to minimise the impact on consumer bills. Additionally, as a natural monopoly, the network effectively sets the cost of infrastructure, subject to business performance and inflation.
The ED2 price control introduced a "Save Now, Pay Later" economic model, which is based on the depreciation rate (i.e., the lifespan) of the assets in an attempt to keep consumer prices low. However, as a result of the network expansion required for CP30 will inevitably necessitate faster cost recovery anyways, particularly as inflation continues to rise and impact to intergenerational inequality. However, due to the current cost of living crisis, consumers will struggle to afford these increases, which may, in turn, limit the ability to expand the network for CP30. Useful article on intergenerational debt by Maxim Frerk: https://www.ofgem.gov.uk/sites/default/files/2022-07/GEP%20Understanding%20Asset%20Lives%20260122.pdf
Look at any pathe film of the 1920's grid build and you will see the men just handballing the steelwork up the towers building them in hours. Now every tower has to be built using mobile cranes and they need temporary access roads building to get them in adding hugely to the costs. Also lets be clear Elf & Safety wasn't uppermost in the minds of our 1920's engineer it now is and be under no illusion how much cost that adds and how destructive of productivity it has become. It was absolutely correct that H&S was improved too many people lost lives and limbs but an underpinning principle of the 1974 H&S at Work Act is now plain disregarded across all UK industries. That is the principle of ALARP (As Low as Reasonable Practical) in favour of zero accidents or incidents but laudable though that is driving it from <1% to zero is taking a huge amount of time and effort for very little benefit. Another area which massively influences managements behaviour now is the ever present threat of litigation leading to a risk off approach to everything they do.