


How did Britain pay for the last ‘Great Grid Upgrade’?
Looking back to a simpler, and more transparent, time

Earlier this month, Larry Fink's BlackRock made a huge investment of $12.5Bn in Global Infra Partners. The titan of finance cited 'The global need for infrastructure combined with high deficits constraining government spending creates unprecedented opportunity for private capital to invest in infrastructure'. We need to build a lot of networks (electricity, gas, hydrogen and carbon dioxide, plus water, telecoms, rails… all at the same time) and with governments facing fiscal constraints, the market can step in. This seemingly ‘win-win’ logic is an unquestioned part of the ‘natural order’ of the energy system. Has it ever been thus?
Caveat: None of the below is original. I have relied on the extensive writings on the topic by Dieter Helm, Robert Millward and Avner Offer. I did a bit of data collection in public libraries.
TLDR
The last time Britain built energy networks at scale between 1950-1980, it was financed with a pay-as-you-go approach by state owned organisations. Current customers and taxpayers paid. This was very different to the ‘Fink approach’.
Pay-as-you-go was simple, transparent, and flexible. But it wasn’t a blank cheque. The nationalised industries agonised over the right ‘self-financing’ level from current customers. This was ultimately a debate about how to reconcile the break-even requirement and public/social objectives. Pay-as-you-go allowed that debate to happen.
Pay-as-you-go was the natural choice of funding mechanism for a generation of politicians and engineers that saw it as their obligation to build an endowment for future British citizens.
Since 1990 the model switch to pay-when-delivered (a la Fink). The taxpayer stopped funding infra. Debt stepped in. Gearing went from 20% to 50-70%. But there wasn’t much new infrastructure building.
Regardless of its economic merits, pay when delivered is complex and it obscures the cost of networks from customers.
Pay-when-delivered also makes it very difficult to confront a fundamental trade-off we face when building networks for net zero; how much should the current generation pay vs future generations?
Pay-when-delivered could be adapted. In the USA utilities have a capped ‘rate of return’. In Europe the state is more directly involved and has part ownership of networks.
‘Pay as you go’: 1948-1980
The last time Britain spent lots on expanding energy networks was before privatisation, from 1950-1980 when the energy industry was nationalised. Figure 1 below shows the huge increase in CAPEX on electricity network expansion from 1950-1970. CAPEX grew 373% from 1948 to the peak in 1967. Average capex was £4.0Bn per annum from the peak years of 1955-70, in today’s prices. This understates the spend on energy networks as a whole because it doesn’t include the gas CAPEX, which was significant from 1950-1980 as the industry went through three dramatic shifts in gas production technology (1. gas-from-coal to gas-from-oil production, 2. first use of Liquified Natural Gas, and 3. Pivot to Natural Gas from the North Sea).
Figure 1: Electricity network capex, 1948-2020
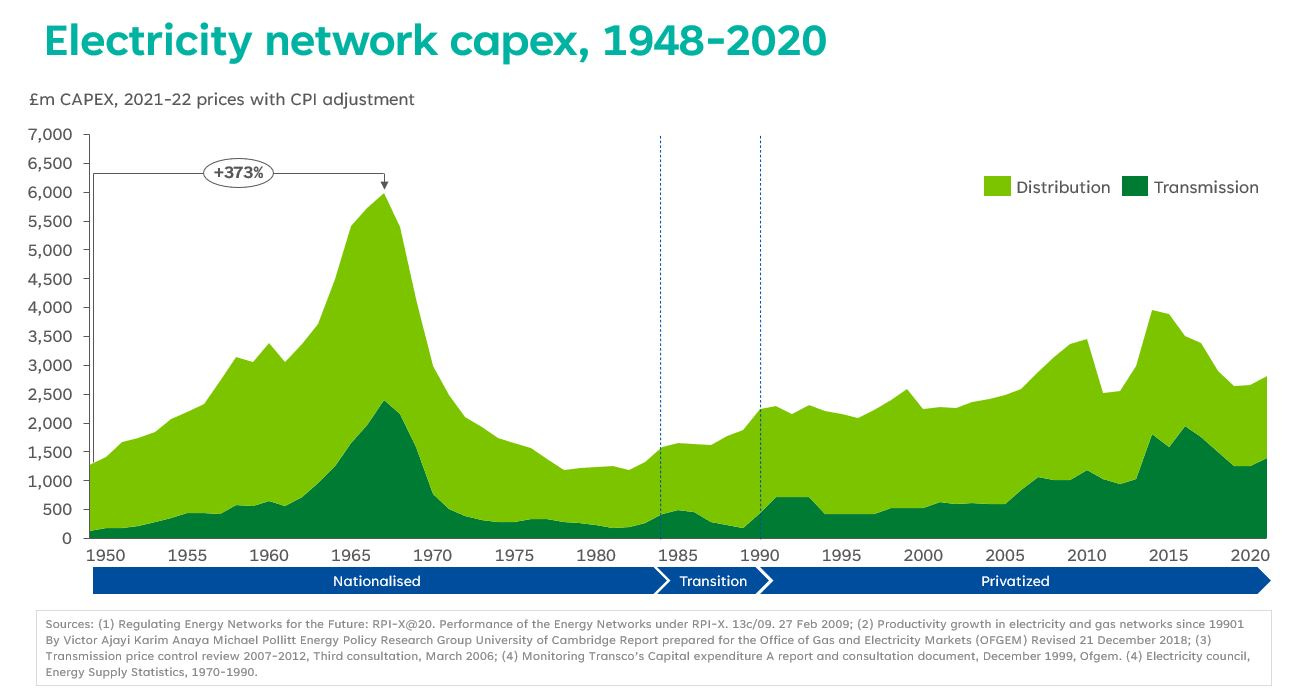
The energy industry worked on a pay-as-you-go basis: each generation paid for investment out of current income. I.e. consumers and taxpayers funded the CAPEX. The profits that state owned gas and electricity enterprises generated from selling the commodity were ploughed back into paying for capital investments. Where profits were insufficient, CAPEX was funded by the state, and the state could fund this expenditure from transfers, loans or fixed interest stock issued/guaranteed by the state. This didn’t mean that the state wrote a blank check. In 1961, 1967 and 1978 the Treasury ratcheted up financial controls to impose ‘capital discipline’. Projects had to use rates of return (although low ones), discounted cash flow analysis, and appropriate ‘marginal pricing’ approaches.
How much of the bill should fall to customers or taxpayers? This was a perennial debate from the 1950s. State owned energy companies were tasked with two very difficult to reconcile objectives; to act in the public interest and to financially ‘break even’. Organisations like the Central Electricity Generation Board (CEGB) and Gas Council came into existence to address a perception that the market had failed and would continue to fail. The benefits of pure capitalism had been brought into question by the Great Depression of the 1930s, and the War effort had demonstrated what could be accomplished by top-down planning. State owned enterprises were part of a national plan to rebuild the productive capacity of the economy. It was more than a commercial endeavour; the goal was to promote regional development, improve living standards, grow employment, and to offer a universal service at a single price for all. On the other hand, these organisations were asked to ‘wash their own face’. Economists became increasingly influential in the 1950s and 1960s and argued that customer prices were set too low to cover the full cost of the infrastructure (i.e. ‘the long run marginal cost’). The Treasury came to the view bills should increase and capital investments should be ‘self-financing’ through profits. Otherwise, the state would end up picking up the bill and this would ‘crowd out’ private investment.
‘Self-financing’ rates of electricity infrastructure were low when compared to other countries. Figure 2 shows the percentage of capital expenditure that was ‘self-funded’ by net surpluses, defined as revenue minus operating expenses, taxes, and interest charges but without deducting depreciation. Note, the official CEGB statistics do not exclude depreciation from reported ‘self financing’, but I have excluded to make comparable to Robert Millward’s figures for other countries. The opposite was ‘external source funded’, which encompassed a variety of state backed or direct state subsidies. This included stock issues, exchequer advances, overseas loans, temporary borrowing, less debt redemptions, repayment of exchequer loans or advances and purchase of stock redemption fund investments. It is not possible to split how the networks were financed vs the generation assets. Three conclusions can be made:
The British electricity sector was more reliant on state financing than other state-owned sectors (gas, electricity, water, rail, coal etc), and than in Italy and France.
There was a decline of self-financing over the 1970s.
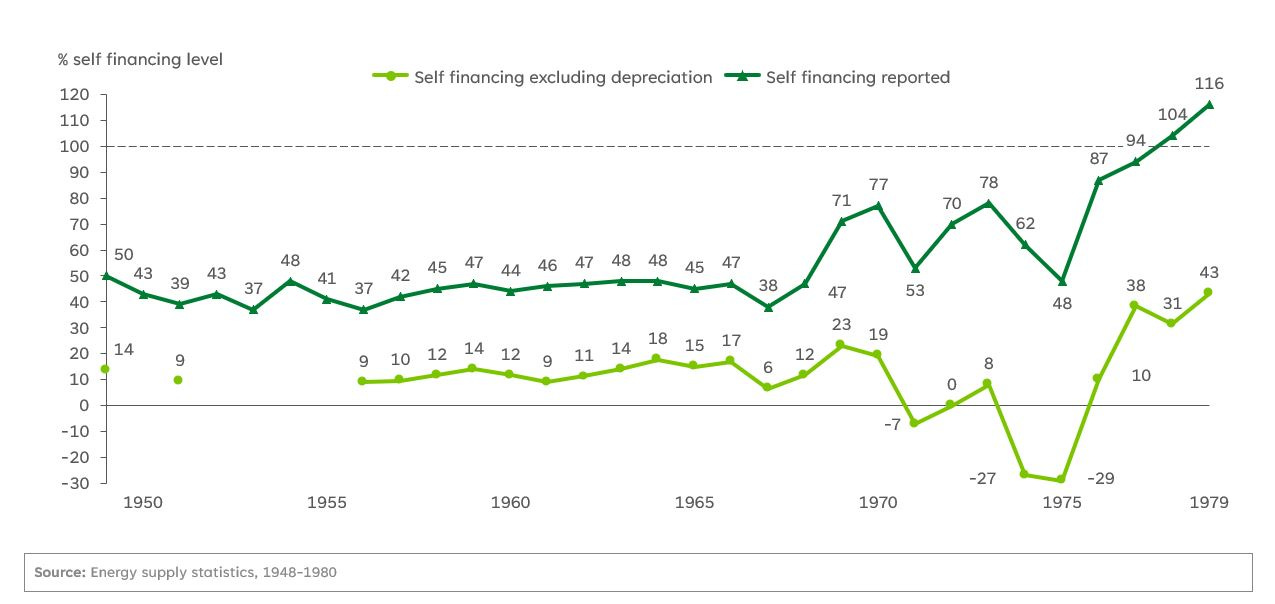
Official statistics potentially overstated the ‘self-financing’ rates for the CEGB because depreciation is included as a form of internal funding (see figure 3).
Figure 2: Self financing levels for the electricity industry and other public corporations in UK and other European countries.
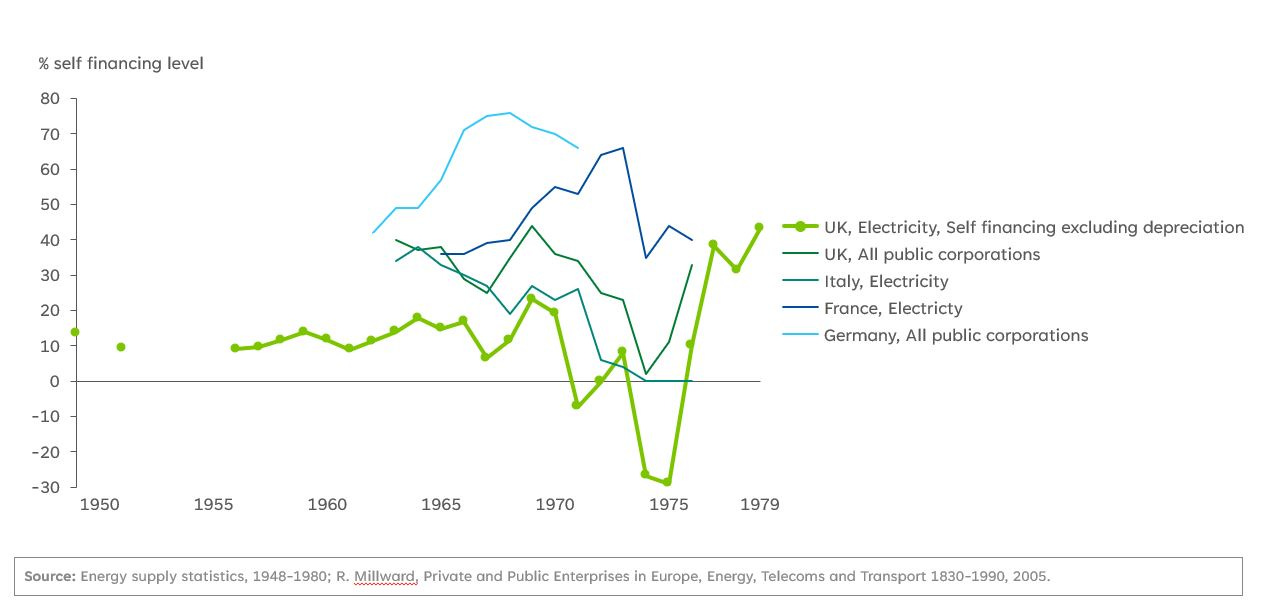
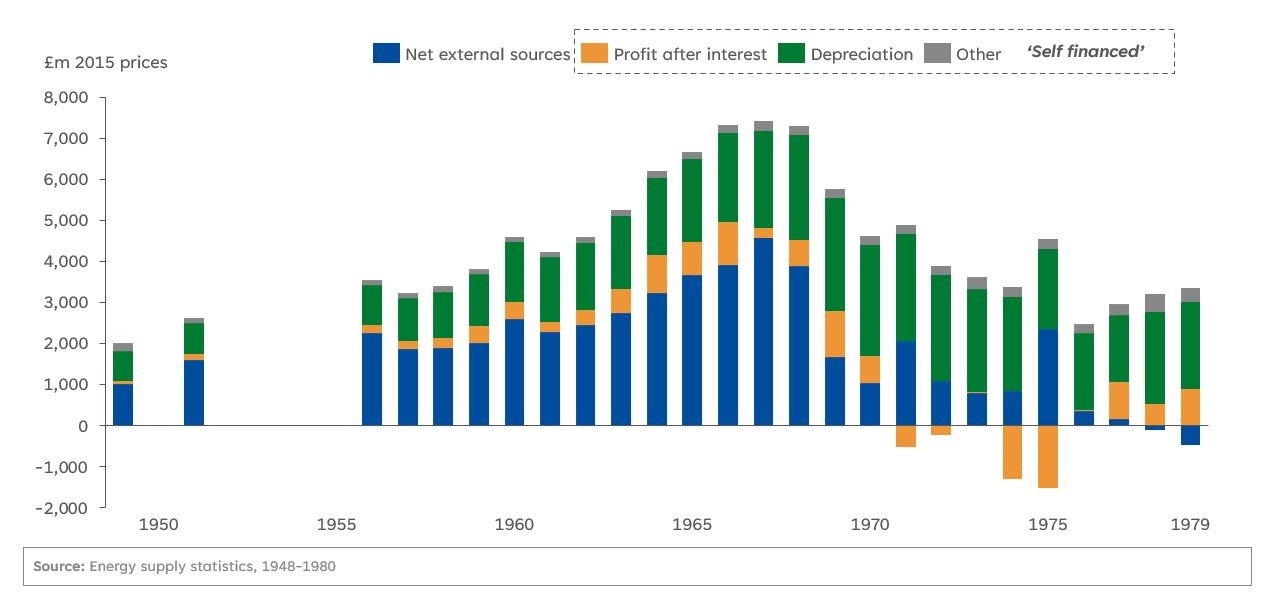
Figure 3: Reported self-financing levels of British electricity industry vs corrected levels, 1948-1980, and total capital requirements and financing by source
The Pay-As-You-Go model was simple, transparent, and flexible. Simple because it made very clear who was paying at any one time: the consumer, or the taxpayer. This exposed the contradiction between the public good objectives and break-even requirement placed on the energy industry. It was a contradiction that was never solved. As several economists and historians have shown, prices were clearly set too low to recover the long run marginal cost of the energy system. Consumers weren’t paying enough, and there was never political consent to confront this. This could be seen as a failure. But the point is that the contradiction could never be solved (unless you believe complete and perfect markets can exist). The pay-as-you-go approach at least made this transparent, and society could make a choice to hold bills down and fund the ‘great grid upgrade’ from general taxation. The cost of capital for the energy system and its subcomponents was just a part of the cost of government borrowing. This meant that governments could flexibly choose which ‘tax base’ to charge for infrastructure; taxpayers (via a progressive tax system) or consumers (via a regressive single price). Increasing prices would shift the risk from investors to customers, or in other words from future generations (who must pay back some portion of government debt) to current generations.
Pay-as-you-go was the natural choice of funding mechanism for a generation of politicians and engineers that saw it as their obligation to build an endowment for future British citizens. This may seem counterintuitive; a pay-as-you go approach is well suited for delivering on long term multi-generational obligations. You may think that ‘saving and then spending’ a capital stock is more prudent and enduring. But as Avner Offer so lucidly explains, this isn’t the case. “Governments succeed where markets fail because they do not commit to long-term contracts… Transfers take place in the present. A financial balance is a hoard. Once spent, it is gone…. PAYGO is a claim on ‘the community’s indestructible real tax base’. In effect, it is a claim on a share of GDP—how much to be revealed when it becomes due for payment.”
The treasury’s financial rules maintained capital discipline and stopped the endowment builders from thinking they had a blank cheque. These rules were prudent but modest. One of the reasons why the electricity was able to build so fast was that they weren’t concerned the rate of return. In 1951 the architects of the 275KV supergrid, Sawyers, Forrest and Lane, gave a paper to the British Electrical Authority to set out their plans. In the 19 pages there isn’t a single reference to a target rate of return, and only one cost estimate is given for the project as a whole. There is however a very simple but compelling analysis of the value of the scheme; a simple chart showing the cost of electrical transmission at different lengths vs transporting coal via rail (see figure 4). The 1961 Treasury white paper was the first to introduce a ‘target rate of return’, but ‘social obligations might justify a lower target’. The rate was also set low – 8%. From 1978 the ‘required rate of return’ was set at 5% ‘across the whole portfolio of investments’, so within that there could be very low rate of return projects offset by high ones. The 1978 rules also asked for KPIs, cost projections and other performance targets. Whether correlation or causation, it is striking that the nationalised industries stopped building infrastructure when Treasury started to ask these organisations to behave like private businesses.
Figure 4: The value based argument for the 275kv supergrid in 1952

‘Pay when delivered’: 1990-2020+
Privatisation and liberalisation switched the funding model to ‘Pay-when-delivered’. The idea was to let the private sector borrow in the present to pay for infrastructure, which would be paid off over multiple generations of customers. Customers would just have to pay a little more for the cost of capital.
The full implications of this have been meticulously described by Dieter Helm. In short, it created a financial arbitrage opportunity. The regulator (Offer, Ofgas and then Ofgem) needed to estimate the ‘cost of capital’ and pay the network companies an allowance for that. That estimate might be different to the real cost of capital, and the difference created an opportunity. In the 1990s the boom in mergers and acquisitions and the entry of US utilities was partly because the cost of borrowing was lower in the US (because US utilities were vertically integrated with simple low risk ‘rate of return regulation’). The other lever was to increase the share of borrowing from debt vs equity, or ‘gearing’.
The increase in ‘gearing’ levels since the 1990s has been quite steep. Figure 5 shows the current gearing levels for the various network companies. I found it hard to get data on where these levels were in the early 1990s, but in 1998 National Grid Group (which at that time owned NGET, NGGT and Cadent) had a gearing level of 24%. Racking up gearing was a rational approach in the context of low interest rates. And the regulator condoned the move. In 1998 an Ofgem (Offer at the time) study noted that a ‘number of [companies] have credit ratings above the minimum investment grade level…. [and] suggests that many… have the scope to increase gearing… Gearing levels of about 50 to 60 per cent would be consistent with an efficient capital structure’.
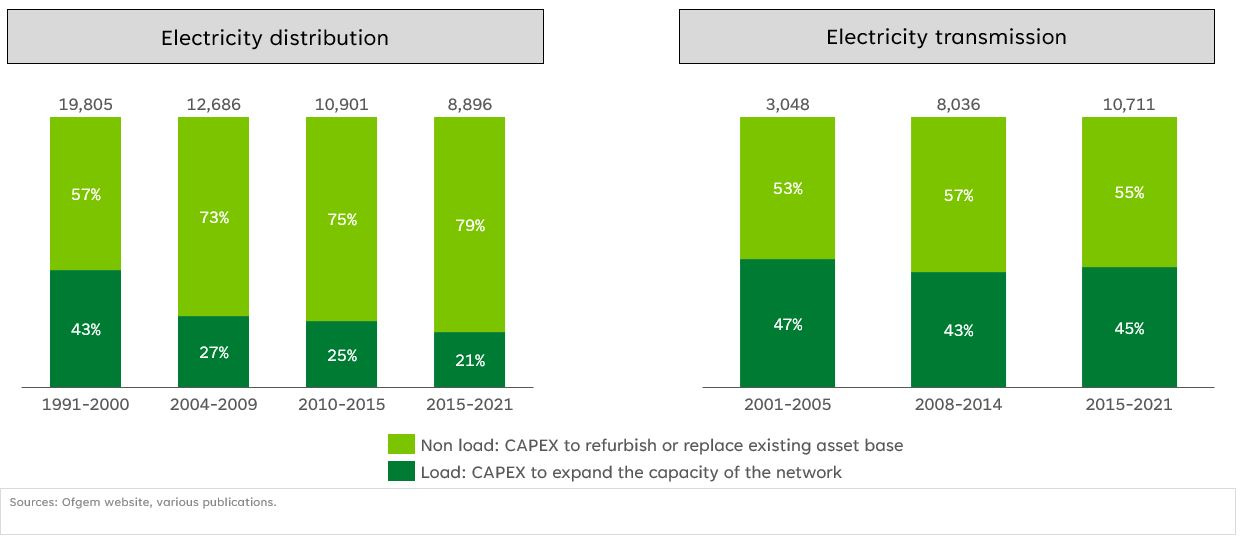
Contrary to what was intended, the increase in gearing did not lead to a major expansion of the network. As figure 1 shows, CAPEX was persistently lower in the 1990s than the 1950-1980 period. It is also important that most of that CAPEX was not to build new stuff (or in technical terms ‘load’ capex). 50% to 80% was for refurbishing and replacing the existing asset base (non load capex) – see figure 6. For Dieter Helm the regulator should have restricted the use of balance sheets to pay for new enhancements.
Figure 5: Gearing levels for energy network companies in the UK today vs National Grid in 1998.
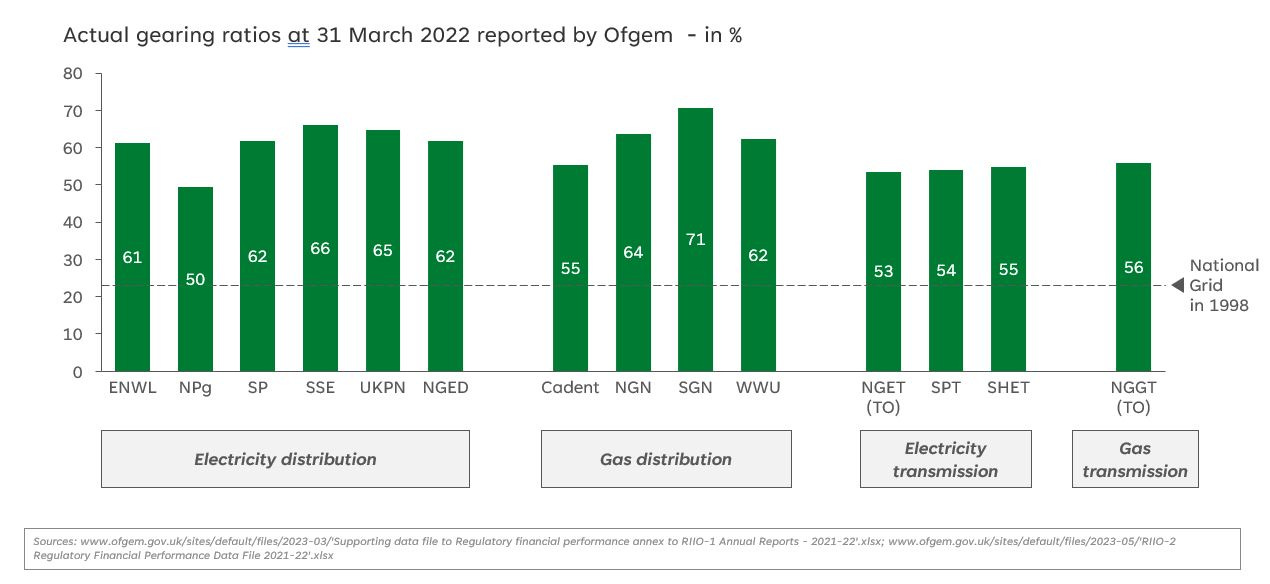
Figure 6: Split of CAPEX between ‘non load’ and ’load’ 1991-2021, electricity transmission and distribution
Pay-when-delivered is quite very complex to understand. I think most industry insiders would agree that the way the cost of capital is calculated is extremely complex and has flaws. For evidence, please see Dieter Helm again. For the brave, have a go at the finance annex for the last regulator deal for electricity, gas transmission and gas distribution. See how far you get…
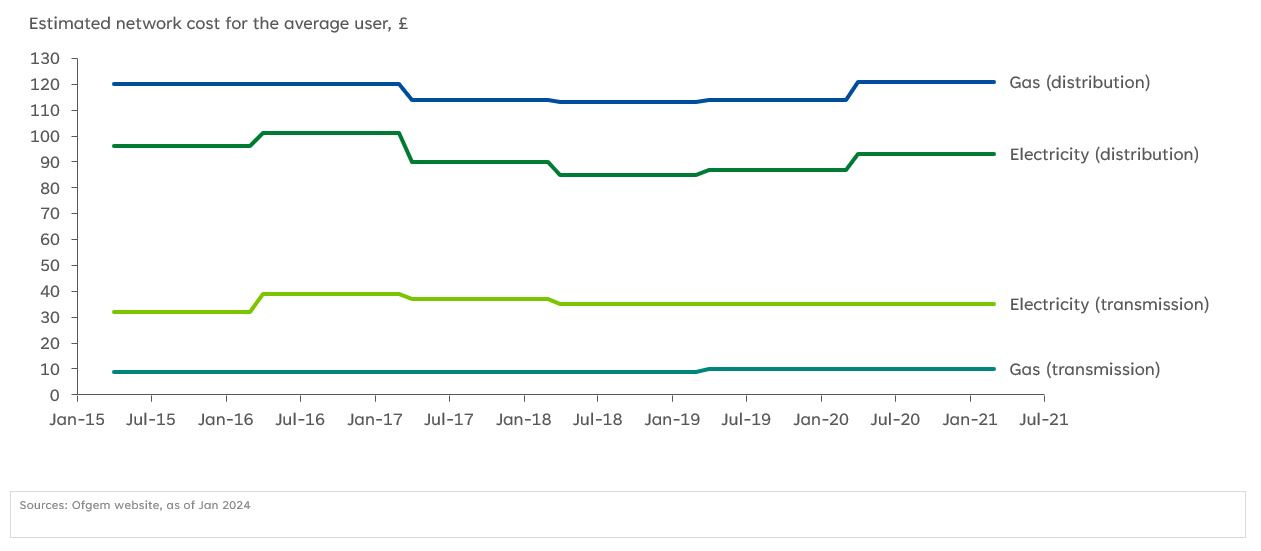
The complexity of pay-when-delivered obscures cost from customers. Go to the ‘energy network indicators’ section of the Ofgem website and there is a dashboard showing the ‘estimated network cost per domestic customer GB average’. It shows that over the period 2015-2021 costs have stayed almost completely flat in all four network sectors. The capex has increased steeply since 2010 in electricity, but bills have remained largely flat. This was partly achieved because of low interest rates. This apparent ‘delinking’ of expenditure and the bill may seem great news, but it is a real issue when capex has to dramatically rise because it means overturning the precedence of flat bills. The use of ‘uncertainty mechanisms’ has also held back the potential bill increases. This is where Ofgem defer agreeing to fund some CAPEX (or OPEX) until the need becomes more certain. When Ofgem announced the electricity distribution price control for 2023-2028 it could claim ‘no increase in bills’ despite a significant increase in capex, partly because a bunch of capex was pushed into the ‘uncertainty mechanisms’.
(As an aside, I think the term uncertainty mechanism (UMs) is misleading. It isn’t a mechanism for making investments in the case of uncertainty, like the Pay-As-You-Go system that funded the networks in the 1950-70s. The ‘UMs’ are actually certainty mechanisms. I.e., funding can’t be approved until there is certainty of the need e.g. demand for a connection materialises or more money is spent to find out more about the condition of the assets).
Figure 7: Network charges to customers stay flat since 2015
Pay-when-delivered also makes it very difficult to face up to the fundamental trade-off we face when building networks for net zero; how much should the current generation pay vs future generations? If today’s customer bills are held flat, you need to borrow more to fund the infrastructure buildout. This will increase the cumulative cost and push that cost onto future generations. But the point of building the networks out now is so this generation of polluters preserves the wellbeing of future generations. The alternative is to increase bills now. But in a cost-of-living crisis there is a limit to the extent to which this is possible. These issues could come into even starker focus in any transitioning from methane to hydrogen as there will be the question of how to deal with any ‘stranded RAV’ and how to deal with decommissioning costs. Where pay-As-You-Go resolves this tension is through the state funding route.
Pay-when-delivered has variants that Britain could explore. In his marvellous book Understanding the private-public divide, Avner Offer makes a compelling case for why the state is such a persistently large part of GDP. Governments make long term investments because markets are impatient, and the state endures. When interest rates rise, markets get more impatient. There are ways to enable businesses to ‘operate beyond payback limits’. One is financial mania. The British Railways were built by a bubble. But tellingly in other countries the state played a more prominent role through direct involvement or subsidies. The other is a ’social franchise’, which in theory is the model Britain has for energy networks. But there are two areas where the UK’s model is unique. 1) We don’t have the fixed rates of return that are a common feature of the social franchises in the US energy system. Capping profits is a helpful way to improve public buy-in. 2) We don’t have direct state ownership and subsidies like in European energy networks and in our own past.
Sources:
275-kV DEVELOPMENTS ON THE BRITISH GRID SYSTEM By SAYERS, FORREST, LANE. 1952.
Robert Millward, Private and Public enterprise in Europe, Energy, telecoms and transport, 1830-1990. 2005.
Avner Offer, Understanding the private and public divide, 2022
Avner Offer, THE ECONOMY OF OBLIGATION: INCOMPLETE CONTRACTS AND THE COST OF THE WELFARE STATE, Discussion Papers in Economic and Social History Number 103, August 2012
Dieter Helm, Energy, the State, and the Market: British Energy Policy Since 1979, 2003
Dieter Helm, The cost of capital, the regulatory asset base and risk, 26 September, 2023. Helm website
Dieter Helm, Energy network regulation failures and net zero, January 2023. Helm website.
Accounting for economic costs and changing prices, HMT, Vol 1 annex 1, 1988… I am extremely grateful to Ian Rowson for finding this document!
Bank of England website
Ofgem website
Interesting post. A couple of things come to mind in response:
1) Pay-when-delivered combined with a progressive tariff structure could be an interesting solution to the tension you note between investment and who pays. Seems like we are stumbling into that with social tariffs, but we might want to be considered in how the industry goes about that rather than accidentally!
2) I think your analysis around the decline of investment pre- and post-privatisation isn’t consistent across all sectors at all times. Second, there is the role in the regulator in this -- provided the appropriate cost of capital is set (which, if it isn’t, explains why equity investors may seek higher leverage in the face mandatory investment) investors have little issue in providing capital. Rather regulators have prioritised short-term bills / affordability considerations over longer-term interests (and also at the ultimate expense of bill volatility as well -- e.g. see the PR24 bill hikes to pay for catch up investment). Hopefully (1) above provides a release valve to allow for a more balanced calibration by the regulators against bills today vs infrastructure tomorrow.