


How do you incentivize ‘Big things to get done’ when it comes to energy networks?

TLDR… the basic argument.
In their best seller How Big Things Get Done Flyberg and Gardiner identify an ‘iron law’ for mega projects; ‘over budget, over time, and under delivering on the benefits case’. That should be a concern for energy networks trying to build at an unprecedented scale and pace.
The history of electricity networks since privatisation suggests we should also be concerned about ‘underspending the budget, and underdelivering the benefits case’.
The current regulations incentivize network companies to underspend the capex they have been approved (termed ‘outperformance). This leads to a pattern of capex ‘shifting to the right’, as projects are delayed while companies look for opportunities to ‘outperform’. This has been an enduring pattern since the mid-1990s.
There are alternatives ways to regulate networks that might be better suited to the asset building phase we are entering. Rate of return regulation is a simple way to cap profits and incentivizes speed.
Contrary to received wisdom, there is little evidence rate of return regulation leads to ‘over capitalisation’. The notorious Averch-Johnson effect is a bogeyman.
As ever…. all views my own.
How Big Things don’t get done… Overbudget, over time and under delivering on the benefits
The iron law of mega projects. In their recent best seller How Big Things Get Done Bent Flyberg (the global expert in mega projects) and Dan Gardner identify a universal law of big projects. ‘Over budget, over time, under benefits, over and over again’. The scale of error is staggering. Across 16,000 capital projects only 48% are on or under budget. Only 8.5% are also on or under time. And only 0.5% deliver the projected benefits plus being on time and on budget. Why? Flyberg and Gardiner focus on behavioral psychology. Our optimistic minds overestimate benefits and underestimate costs. We are bad at dealing with uncertainty and black swans. Cost estimation methods assume each project is ‘special’ and not like all the ones that went before it. Bravado encourages leaders to build too big and rush into build.
Bad news for net zero and energy networks? Maybe not. To deliver net zero we need to build a gargantuan amount of stuff. If the ‘universal law’ holds, we best get prepared for a lot of overruns and under delivery. But fear not. There is a bright ray of light buried in the appendices of How Big Things Get Done. Some of the projects that are critical for net zero perform quite well. Solar, wind, pipeline (assuming hydrogen or carbon dioxide), and electricity transmission projects have low average overruns and few mega overruns. Why? Flyberg and Gardiner offer a technological explanation. These project types are modular, like Lego. Small building blocks are aggregated to make larger structures. This gives asset builders flexibility to create something suitable for that environment without losing the benefits of standardisation. ‘Modularity delivers faster, cheaper and better’. Repetition allows experimentation, learning, and construction can be adapted as the project develops.
Figure 1: Cost overrun performance of different types of project. Green = Particularly critical for getting to net zero power system.

How Big Things Get Done is a magnificent book but there are four weaknesses to the argument.
1. Accurate forecasting isn’t the only measure of success. Cost per unit of ‘useful output’ is probably more important. Imagine two solar projects. The first one hits its initial cost, time, and benefit estimates, the second doesn’t. But the second project delivers a lower cost per kwh of capacity than the first project. Which project is better? As the great economic historian Avner Offer points out ‘Did they do it right’ is not the same as ‘were they right’.
2. The ability to accurately forecast is a very high bar. It seems to place an unrealistic burden on capital projects to have the power of prescience. Offer again… ‘The initial design is given an authority which it cannot bear… long term projects are too complicated to specify completely in advance’.
3. Going over time and over budget may be worth it to deliver the benefits. This seems acutely true for projects to get to Net Zero.
4. An overfocus on psychology and technology, vs incentives and institutions. Psychology and technology explain a lot, but variation in misestimation between projects and industries can also be understood as a product of the incentives project managers face and the institutions that define those incentives.
Let’s explore these further through the history of the UK’s electricity networks since the 1990s.
Note… Everything that follows is as applicable for gas networks. I’m only focussing on electricity because of the scale of the spend between now and 2040.
Case study of the UK electricity networks… at risk of underspending and underdelivering?
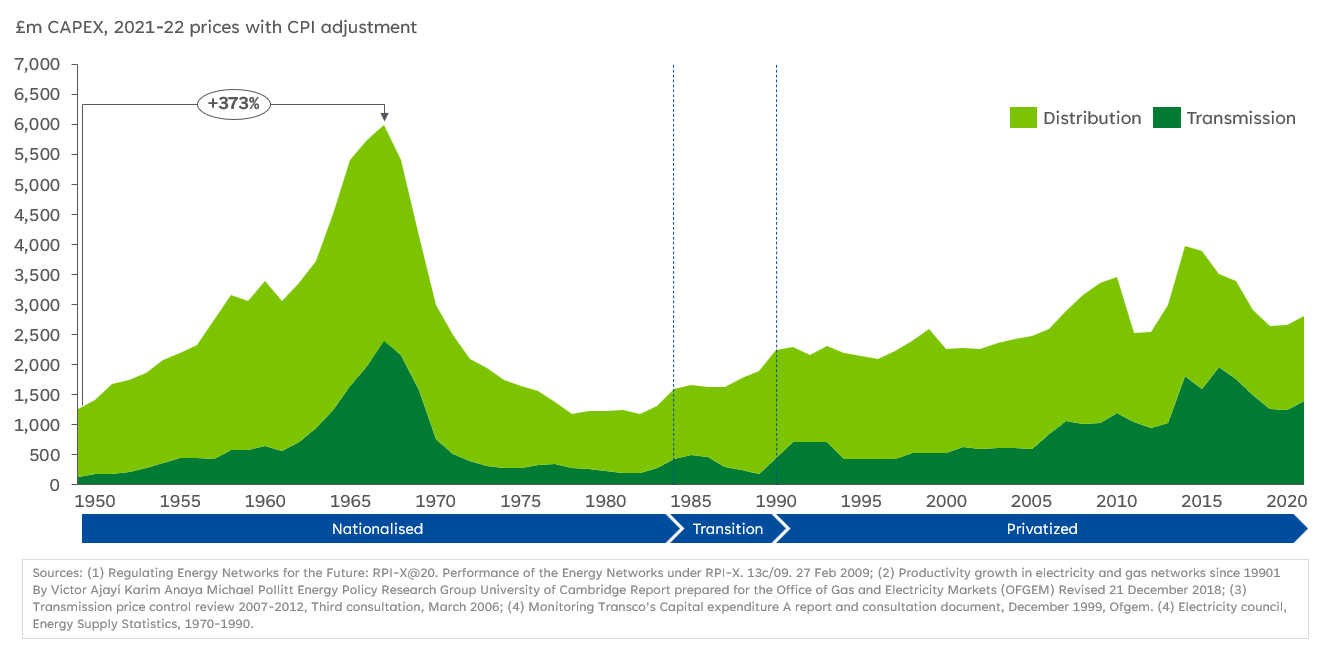
Risk of underspending the budget and underdelivering on the benefits. Firstly, because the industry hasn’t built networks at scale for a long time. Readers of this blog will be familiar with the capex profile for electricity networks since 1950 (figure 2). The period since privatization in the 1980s has been one of asset sweating, not an asset building. Energy networks will need to pivot to deploying capex at an unprecedented scale at an unprecedented pace.
Figure 2: Electricity network capex, 1950-2020.
Regulation has incentivised underspending vs budgeted ‘allowances’. The second reason to be concerned about underspend and under-delivery… regulatory incentives. I am going to try to make the following simple, but I apologise in advance if I fail. Since 2013 the way networks are paid is defined by the RIIO regulations (RIIO stands for Revenue = Incentives + Innovation + Outputs). At the start of a 5-year period (the ‘price control period’) companies estimate how much funding they need to deliver certain network outputs or outcomes. ‘We need £1Bn to reduce the probability of assets failing by replacing them with new ones’, ‘we need £2Bn to upgrade the capacity of this circuit’ etc, etc.. The RIIO regulations are known as an ‘outcomes based’ approach. Ofgem then interrogates the plan and approves a level of ‘baseline allowances’. Usually ‘allowances’ are less than the funding requested. Network companies then spend the capex and this is added to their ‘asset base’. They earn a pre agreed ‘rate of return’ on the value of those assets. But RIIO has a clever mechanism, colloquially known as ‘TIM’ – the ‘totex incentive mechanism’ (totex = capex + opex). If a network spends less than the allowances it can keep some of the difference, but a proportion is given back to end consumers. The TIM mechanism incentivizes networks to spend less than the allowances. Figure 3 shows how powerful the incentive is; since 2008 grid companies have spent quite a lot less than the capex allowances they were awarded.
Figure 3: Over or underspend of allowances in electricity grids, 2008-2023.

How have grid companies spent less than their allowances? Ofgem’s 2020-21 annual report on the electricity transmission sector provides a helpful explanation.
1. Factors outside of their control. E.g. Deferrals to customer connections have pushed out some ‘network growth capex’.
2. Efficiency. Doing the planned volume of capex projects but at a lower cost per project through things like ‘lean engineering design’ or procuring equipment in bulk.
3. Innovation in delivery method. E.g. Finding a way to increase the capacity of the network without necessarily doing the capex project that was originally planned. Like a ‘Smart Wire’.
4. Not doing the project. National Grid Electricity Transmission spent 40% less than its ‘Network Replacement capex (or ‘non-load’) allowances since 2013. Ofgem reported this was due to ‘a revised understanding of the asset condition, extension of asset lives and more targeted asset replacement’.
Capex ‘shifting to the right’: The four reasons above are all valid. And in the RIIO regulations what matters is whether the network outcomes are delivered, not whether the money was spent. Ultimately both companies and consumers benefit thanks to our friend TIM. But there is a downside. Searching for opportunities to outperform can lead to delays to construction. The capex profile starts to ‘shifts to the right’, as is evident in figure 4. The light green bars show the capex profile that Ofgem and electricity transmission companies agreed in 2013, and the dark green bars show actual spend. A slow start and then a catch up, with a busy last year. Network companies will need to pivot away from this pattern to stay on top of the huge bow wave of capex they are facing out to 2040. But habits are hard to kick. Especially if they have been habits for a very long time.
Figure 4: Profile of capex for electricity transmission sector 2014-21. Predicted spend profile = capex allowances. Actual spend profile = capex expenditure.

Underspending and deferring capex goes back further than 2008. Before RIIO there was an even simpler form of regulation beginning with an R. It was called RPI-X. Companies estimated how much it cost to run the network. The regulator then converted this into a price that customers were charged. That price was adjusted year-on-year based on inflation (using the Retail Price Index, or RPI), but minus an X-factor determined by the regulator. The X-factor represented the ‘efficiency challenge’. This created an incentive for companies to drive down cost, because if they could beat the RPI-X formulae they would keep the difference as profit. RPI-X is known as an ‘incentive based’ approach. The downside was that it created an incentive to ‘sandbag’; companies overestimated how much capex they needed, and then underspent.
In 2000-2001 Ofgem investigated capex underspending in electricity distribution. Figure 5 shows the scale of the problem. In 1993 the companies projected a capex profile that rose to £1.6Bn of capex (1997/8 prices) in 1996/7. But in that year the networks only spent £1.1Bn. So the networks and Ofgem (Offer at the time) re-estimated the capex profile, with a peak at £1.4Bn in 1998/9. The networks spent £1.2Bn in that year. As the economist David Newbury concluded in a seminal book in 1999, RPI-X was great for focussing minds on efficiency but created a ‘risk that it comes at the expense of adequate capital investment’ (Newbury, 1999, p.50).
Figure 5: Electricity distribution capex from 1990-2000

‘Outcomes based’ regulation emerged by 2010 as a fix to RPI-X. By 2000 there was a recognition that RPI-X had limits, and that the regulator needed to shift the focus to quality of performance and to ‘outcomes’ like reliability. There were a series of high-profile projects; the Information and Incentives project, Project Discovery, RPI-X@20. RIIO was the regulatory model that came from this soul searching. The idea was that if the regulator could be clear on what outcomes the money was ‘buying’, then companies couldn’t just not spend their capex without coming up with another way to deliver the outcome. The problem with this idea? (1) It was very difficult to measure the outcomes and the companies would control the input data; (2) it is complicated. In many ways RIIO just formalised all the tweaks to RPI-X that had been gradually made over the nineties and noughties (see figure 6). There was an irony to this. The goal of RPI-X was for regulation to gradually wither away by mimicking competition. But the reality was that regulation grew all sorts of new arms and legs.
Another path was proposed back in the 1990s. In 1995 the think tank the Institute for Public Policy Research published a series on the future of utilities. This was in preparation for the anticipated New Labour victory. Tony Blair even wrote a foreword. In it the economist Michael Waterson argued that regulation of networks should return to an even older tradition, and another regulatory model beginning with an R, rate of return regulation.
Figure 6: The origins of RIIO and the rise in complicatedness. Green = the really significant regulatory changes

A simple alternative… rate of return regulation.
RPI-X was designed in opposition to the ‘rate of return’ model that was dominant in the USA by the 1980s (and still is). Rate of return, or ‘cost plus’, regulation is incredibly simple. A network utility is given some form of legal right to provide services to an area. It builds, owns, and operates assets which have a ‘regulated asset value’. In return for the service the company is given a pre agreed ‘rate of return’ (I.e. a %). If the company expands its asset base by building £1m of assets, it is allowed to collect £1m + the rate of return. The cost plus a bit extra.
Gold plating, rate padding, overcapitalisation… the monstrous Averch-Johnson (AJ) effect. Rate of return regulation gives politicians, regulators, and the public confidence that utilities cannot earn ‘excessive profits’. It gives investors a guaranteed rate of return. The problem is that theoretically it could lead the company to ‘over deploy’ capex. I.e. building more than is required. If the company is paid a fixed percentage rate of return, then it has an incentive to spend more money to increase its overall profits. If you pay me 1p per £1 I spend, why wouldn’t I spend £100? This hypothesis is known as the Averch-Johnson effect, named after the two economists that developed the theory in 1962. The theory was merged with various more colloquial concepts such as ‘gold plating’, ‘rate padding’, ‘watering the capital base’. The AJ effect became the monster that haunted regulators sleep.
But there is very little evidence that the Averch-Johnson (AJ) effect is real. The monster was a bogeyman. In 2005 the economist Paul Joskow came to a devastating conclusion; there was so little evidence for the AJ effect that exploring it for 40 years had been a waste of time and effort. The lack of evidence and theoretical flaws are covered extensively here by Stephen Law. In short:
1. Even in theory the effect disappears once you consider that the company-regulator ‘game’ has multiple rounds. If the company builds a bunch of dud assets the regulator is likely to find out. It will penalise the utility either through disallowing the expenditure from contributing to the asset base, or by trimming the rate of return.
2. The effect assumes that capital and labour are highly substitutable and therefore networks select a higher capital to labour ratio to make a greater profit because of the rate of return mechanism. But in networks capital and labour are not really substitutes and in many cases are complements. An electricity network can’t use labour to deliver electrons to London from Scottish wind farms. It could however spend capital on digital technologies to enhance labour productivity. Stephen Law pointed out the irony. Energy networks are highly likely to be regulated but are the least likely to have a production function that would allow for the AJ effect.
3. Overcapitalization is only an issue if the company tries to build useless assets. But if there are plenty of useful things to build then the real constraint is how much the regulators wants to increase the customer bill. This was pointed as early as 1972 by Edward Zajac; ‘Padding is profitable for the regulated firm only if it has exhausted all positive income producing investment opportunities.’
Many countries still use rate of return regulation for capex. Figure 7 shows how ownership and regulation works in 31 European countries. On the top is the regulatory model (from rate of return to outcomes based). On the left is the ownership model (from all public to all privately owned). The data covers the four energy networks segments: electricity transmission, electricity distribution, gas transmission, gas distribution. Only the UK and Portugal have networks in fully private ownership using outcomes-based regulation. Most countries use ‘incentive-based regulation’ like an RPI-X model. However, even in these countries many only apply incentives to the operating costs (opex). Only 20% of the 31 countries have an incentive mechanism for capex. In other words, most countries use very simple rate of return regulation for capex.
Figure 7: How networks are owned and regulated in a sample of 31 countries.

Yet ‘rate of return’ is still perceived as immature. In a recent landmark study on the global outlook for electricity grids the International Energy Agency (IEA) presented the regulatory models discussed above as a ‘hierarchy’ from least sophisticated (rate or return/cost plus) to most sophisticated (Outcomes based). The Council of European Energy Regulators (CEER) use a similar framework. Tellingly both the IEA and CEER fall back on the undemonstrated assumption that rate of return regulation ‘creates no incentive for efficiency and [the firm] can expand profits by simply spending more’. So too does Ofgem. In a major review of network regulation, it declared a ‘common objection to rate of return regulation is that it tends to incentivise gold-plating of assets.’ (Consultation document, March 23, page 37). Ranking regulation form ‘worst’ to ‘best’ is problematic. Different regulatory mechanisms are suitable for different contexts. Rate of return regulation is not as complex as incentive or outcome-based regulation, but that doesn’t make it less sophisticated. RPI-X was selected because it fitted the context; regulators thought that the nationalised industry had too many employees, and they wanted to incentivise ‘rightsizing’. But the context today is very different; we are moving from asset sweating to asset building, the consequences of underinvestment are existential, and we need to build at an extraordinary pace.
Rate of return regulation incentivises speedy capex deployment. In the past few years, the UK has initiated some radical reforms in electricity, all in service of accelerating the pace of infrastructure development. E.g. connection reform, the National Energy System Operator, the Accelerated Strategic Transmission Infrastructure (ASTI) regime (which will bypass the 5-year RIIO cycle). Rate of return regulation could have complemented all of this. Ofgem has moved closer towards it for the ‘ASTI’ mega projects, capping the max amount of ‘outperformance’ that can be earned. Sadly, Ofgem rejected the rate of return option for the 2026-2031 regulatory period. National Grid even recommended it in 2023, advocating ‘a cost pass through approach with a fixed rate of return’. They argued that this ‘simpler’ approach would (a) accelerate projects into build because it would avoid the need for upfront cost assessments, (b) give investors greater certainty, and (c) refocus attention ‘on timely delivery’. The final point is important. Under rate of return regulation speed is essential. Companies can’t ‘outperform’ by underspending (as under RIIO thanks to our friend TIM). Getting projects complete and assets commissioned becomes one of the most important levers to demonstrate high performance relative to peers.
Conclusion
Under RIIO and RPI-X networks are incentivised to overestimate and underspend. Under rate of return networks are incentivised to spend every penny they are allowed to and do so as fast as possible. There is little evidence that rate of return regulation leads to ‘gold-plating’/‘overcapitalisation’. Regulatory incentives are one plausible explanation for Flyberg and Gardiner’s finding that electricity transmission projects are good at hitting their budgets. Caveat: I can’t say for sure without seeing the data underneath How Big Things Get Done. In the UK, as in other countries, we are moving from an asset sweating to an asset building phase. This is a massive pivot. Sticking with the RIIO and RPI-X approach to capex creates a risk that networks are incentivised to search for opportunities to ‘outperform’ their allowances and underspend. In the process they could end up getting delayed and miss the exceptionally tight timelines they face in trying to deliver net zero. We need those networks to be incentivised to deploy capex with unprecedented velocity. Maybe we should turn to alternative regulatory models… like rate of return regulation.
Great post. As always I think the answer lies somewhere in the middle — capture the capex deployment benefits of RoR regulation while still providing an incentive framework to deliver better outcomes for customers on network performance. I haven’t seen detailed benchmarking which overlays the incentive regime, but given what I’ve seen of no / low powered incentive regimes versus the UK I think this is something we’d want to retain.